How to Analyze ELISA:
1. Run samples in duplicates or triplicates to ensure statistical accuracy. Average the readings for each standard, control, and sample, and subtract the average zero standard optical density (O.D.). This experiment setup helps identify patterns and trends by reducing variability.
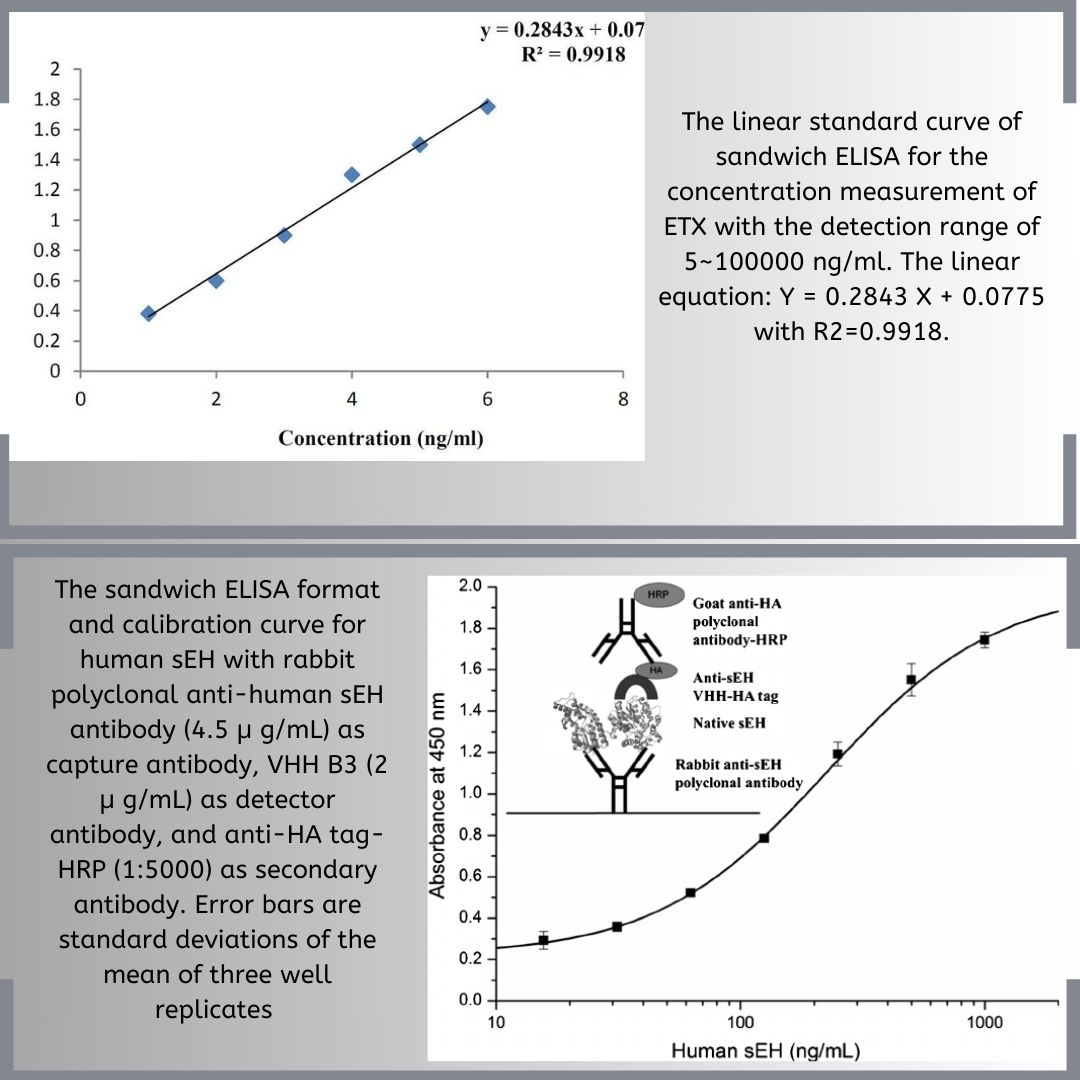
2. Create a standard curve by plotting the average absorbance against protein concentration using appropriate software tools. This visualization technique helps in identifying trends and patterns. Use the method suggested in the protocol or test different statistical methods to find the best fit. Graphs and charts are effective tools for the presentation of findings.
3. To find sample concentrations:
- Locate the absorbance value on the y-axis.
- Draw a horizontal line to the standard curve.
- Draw a vertical line to the x-axis to read the concentration.
- Multiply by the dilution factor if the samples were diluted. Adjusting for dilution is crucial for accurate data presentation.
- Check consistency by calculating the coefficient of variation (CV); it should be ≤ 20% to ensure reliable statistical conclusions.
Data Interpretation:
1. Prepare Carefully: It is crucial to run samples in replicate to check the consistency of pipetting and reduce errors. This meticulous approach in the methodology helps in reducing variability in variables and ensures accurate data interpretation.
2. Include Controls: Use a standard curve, positive control, and blank control samples on each plate to validate the test and remove background noise. Proper controls are vital for drawing accurate conclusions and supporting the hypothesis.
3. Proper Dilution: Dilute samples so they fit within the standard curve range for accurate results. This is a key technique in handling reagents and antibodies efficiently.
4. Analyze Data: Use software to create the standard curve and subtract background readings from blank samples. Adjust sample concentrations using dilution factors. Calculate average values, standard deviation, and coefficient of variation from replicates to ensure reliable and repeatable results. Insights from statistical analysis provide clarity on experimental findings.
5. Determine Cut-Off Value: Calculate the cut-off value for each plate individually, as factors can vary. This variable approach ensures that conclusions are specific and accurate.
Enhancing Curve Fitting in Elisa Assays:
1. Use Non-linear Regression Models: Use 4-PL or 5-PL models for accurate dose-response curve fitting in ELISA assays. These models are advanced statistical tools that provide deeper insights into data patterns.
2. Advantages: These models handle sigmoidal curves and account for assay saturation and background noise, enhancing the clarity of data visualization.
3. Assessment Metrics: Check the goodness of fit using RSS, R², and the recovery of calibration standards. These metrics are vital for validating the hypothesis and conclusions of the experiment.
4. Weighting: Use weighting strategies to improve curve fitting and manage variability across different analyte concentrations. This methodology ensures more precise data analysis.
5. Application: Ensures precise measurements, which are important for biomedical research and diagnostics. The use of advanced techniques and tools in ELISA kits and reagents can significantly improve experimental outcomes.
Linearity Assay:
1. Test ELISA accuracy by diluting a spiked sample (1:2, 1:4, 1:8). This step helps to visualize the linearity and accuracy of the assay.
2. Compare the OD values of the diluted samples against the standard curve. Charts can be useful for this comparison.
3. The results should show a linear relationship; that is, the OD should decrease proportionally with each dilution. Recognizing this pattern is crucial for data validation.
4. If results don’t change linearly, there may be errors. Identifying these trends early on is essential for troubleshooting.
5. Errors at specific concentrations suggest the sample needs more dilution before measurement.
Troubleshooting:
1. Background Noise: Can be caused by not washing enough, contaminated buffers, too much detection reagent, antibody cross-reactivity, or buffer/analyte precipitation. Identifying these variables is crucial for accurate data.
2. Poor Standard Curves: Can be due to mistakes in preparing standards, degradation, incorrect reconstitution, or scale issues. Try different scales like log-log or 5-parameter logistic to fix this. Adjusting these techniques can lead to more accurate graphs and charts.
3. Optimize Conditions: Ensure that assay conditions are optimized, including reagent concentrations and incubation times. Insights from optimization can improve experimental outcomes.
4. Dilution: For samples with high concentrations, additional dilution might be necessary to fit within the assay’s dynamic range. Proper handling of reagents and antibodies is essential to maintain consistency and accuracy.
Explore Our Full Range of ELISA Kits
Whether you’re testing human, animal, or plant samples, MyBioSource offers over 1 million ELISA kits covering thousands of analytes across every major species.
References
- Dorota Danielak, et.al A novel open source tool for ELISA result analysis, Journal of Pharmaceutical and Biomedical Analysis, Volume 189, 2020, 113415, ISSN 0731-7085.
- Raju, C. M., Elpa, D. P., & Urban, P. L. (2024). Automation and Computerization of (Bio) sensing Systems. ACS sensors, 9(3), 1033-1048.
- Fonseca, A., Spytek, M., Biecek, P. et al. Antibody selection strategies and their impact in predicting clinical malaria based on multi-sera data. BioData Mining 17, 2 (2024).
- Wang, J., Sun, C., Hu, Z., Wang, F., Chang, J., Gao, M., … & Yin, X. (2024). Development of a novel monoclonal antibody-based competitive ELISA for antibody detection against bovine leukemia virus. International Journal of Biological Macromolecules, 267, 131446.
- Aydin, S. (2015). A short history, principles, and types of ELISA, and our laboratory experience with peptide/protein analyses using ELISA. Peptides, 72, 4-15.
- Kapoor, T., Murray, L., Kuvaldina, M., Jiang, C. S., Peace, A. A., Agudelo, M., … & MacDonald, M. R. (2024). Prevalence of Powassan Virus Seropositivity Among People with History of Lyme Disease and Non-Lyme Community Controls in the Northeastern United States. Vector-Borne and Zoonotic Diseases, 24(4), 226-236.
- Aziz, A. F. E., Roshidi, N., Hanif, M. D. H. M., Jun, T. G., & Arifin, N. (2024). Giardia lamblia Immunoassay: Systematic review and meta-analysis. Clinica Chimica Acta, 119839.
- Peters, L. M., Reding Graf, T., Giori, L., Mevissen, M., Graf, R., & Howard, J. (2024). Development and validation of an ELISA to measure regenerating island‐derived protein 3E in canine blood. Veterinary clinical pathology.